


Download the 2022 Email Trends and Observations Report
Oops! Something went wrong while submitting the form.


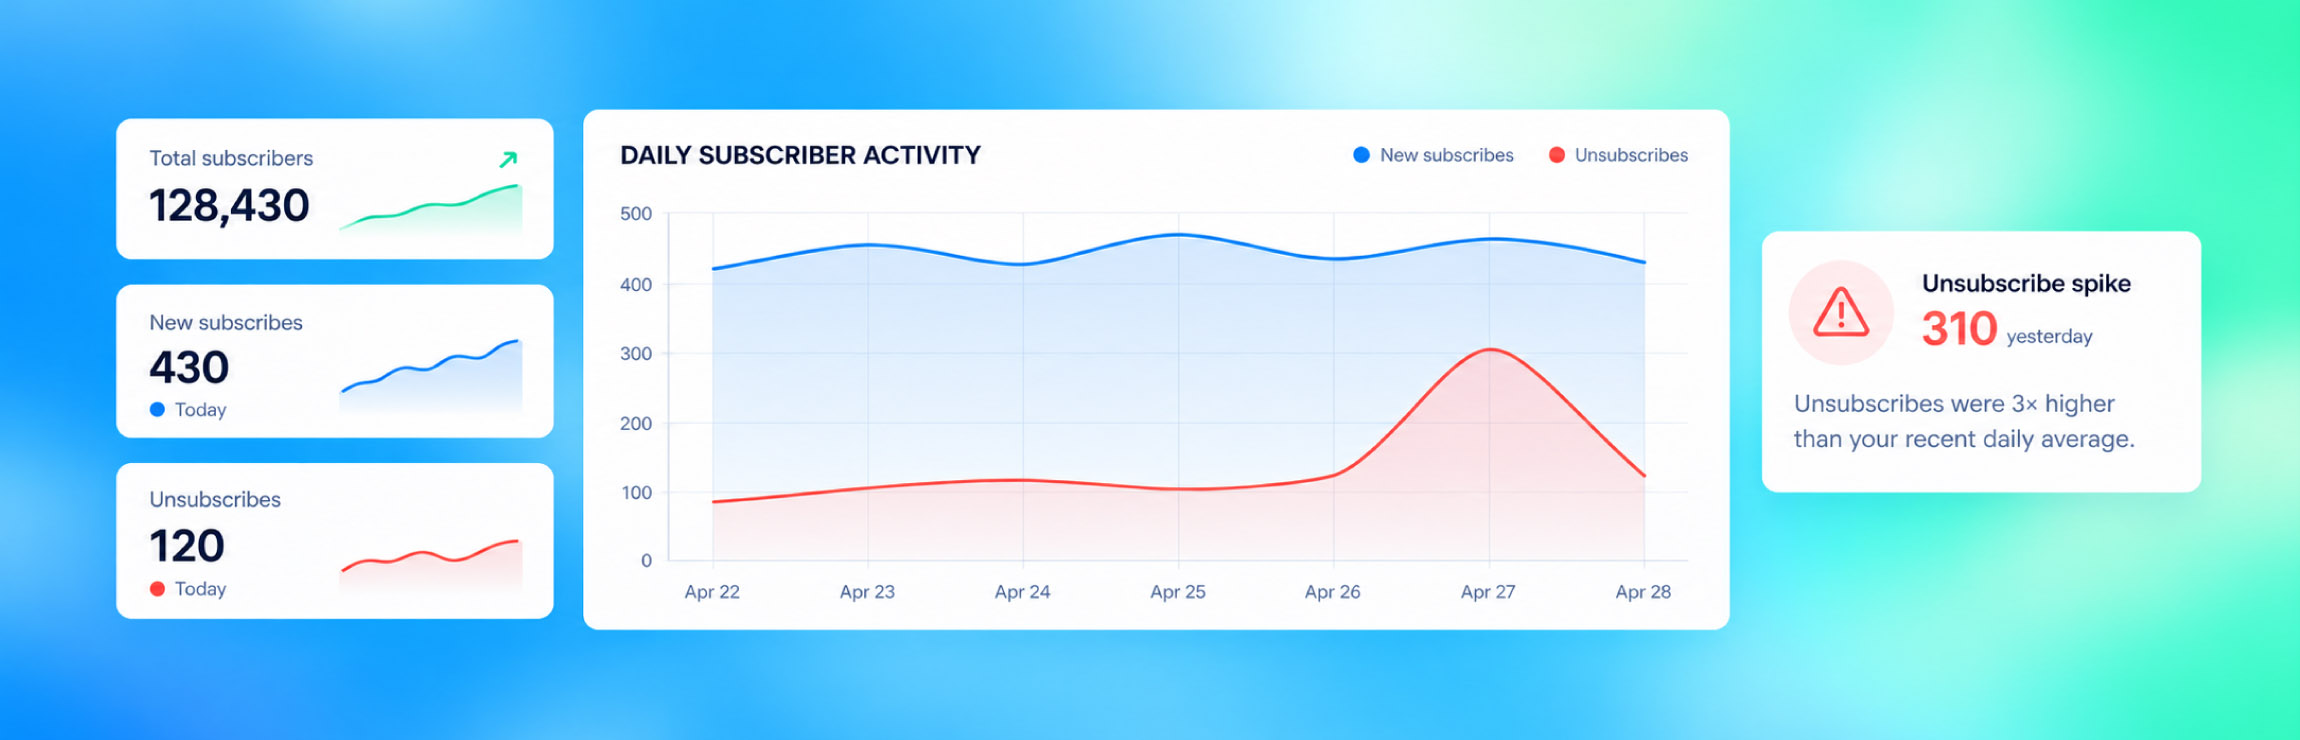
Most retailers keep a close eye on total subscriber count. If the list is growing, things appear to be moving in the right direction.
But total subscriber count doesn't tell the whole story. Changes in daily subscribes and unsubscribes can reveal shifts in list health long before they become obvious in the overall number. And by the time a decline shows up in your monthly totals, it may already be affecting your reach and revenue.
That's why list health should be treated as a leading indicator. Monitoring daily subscriber activity can help marketers spot changes earlier, understand what's driving them, and take action before they have a larger impact.
Total subscriber count can look healthy even when something underneath is changing. Looking at daily subscriber activity can help uncover trends that the overall number may be masking:
Listrak's reporting capabilities give marketers greater visibility into list health and the flexibility to build, save, and regularly review reports that can surface changes in subscriber behavior.
Two reports can provide a clearer picture:
Listrak clients can use Exportable Reports to build and customize these views. See how to get started with Exportable Reports.
For a sharper read on whether growth is actually valuable, marketers can cross-reference subscriber activity against order history. Comparing order count and total spend for contacts a list gained or lost during a given period adds important context. Losing a thousand subscribers who never ordered is a very different problem than losing a hundred who represent real revenue.
Catching list health issues early starts with knowing what “normal” looks like for your unsubscribe rate. When a baseline is established in advance, a meaningful deviation is easier to identify when it happens rather than weeks later.
Schedule Listrak's daily list-health view to hit your inbox on a recurring basis, agree on a threshold that triggers a closer look, and treat list health with the same operational importance as other leading indicators in the business.
Because ultimately, list health isn't just about the size of your list. It's about protecting the reach, engagement, and revenue that come with it.


