


Customer Analytics That Go Beyond Average Order Value
.jpg)
Customers are all the same, right? Can’t we just pull metrics from our customer analytics and build strategies using averages? Perhaps. But what happens when you start digging deeper into the averages? Customers know they aren’t average and they don’t expect to be treated as such.
That’s why you need to understand your customers on a more granular level. Knowing where they are coming from, what they are purchasing, and how much they are spending on each visit helps you to determine opportunities for product recommendations and the potential for increased sales.
In this article, we’ll take a closer look at the analytics that go beyond simply looking at average order value.
Understanding Customer Average Order Values
Before jumping right in, here’s a quick average order value (AOV) 101. The AOV is simply the average dollar amount that your customers spend each time they place an order on your website or mobile app. To determine your AOV, you will want to divide the total revenue by the number of orders.
Here is a very simple equation of how you can determine your AOV. If your sales for the month were $50,000 and you had 1,000 total orders, your monthly AOV would have been $50.
$50,000 (Revenue)
------------------------- = $50
1,000 (Total Orders)
It’s a pretty simple equation, but it’s important to have an understanding of AOV before jumping into the additional analytics you’ll want to use. Understand your AOV is only one step to improving your marketing efforts and increasing sales revenue.
Now, Let's look at how we can unpack metrics based on AOV.
Median Order Value Vs. Average Order Value
Before we get into a statistics course, I just want to point out the difference of average (mean) versus median. A median can eliminate outliers on the high or low end of your data set since it’s simply the middle value. However, if you have a shifted bell curve, you can end up with a median above or below the average. In a perfect world, they would be the same number.
Here’s an interesting look at how the AOV compares to the median order value for a retailer’s customer base. Notice how different the AOV is from the median in upper revenue deciles. This indicates we have outliers pushing the average way up, while the values converge to approximately the same number around deciles 4 to 9.
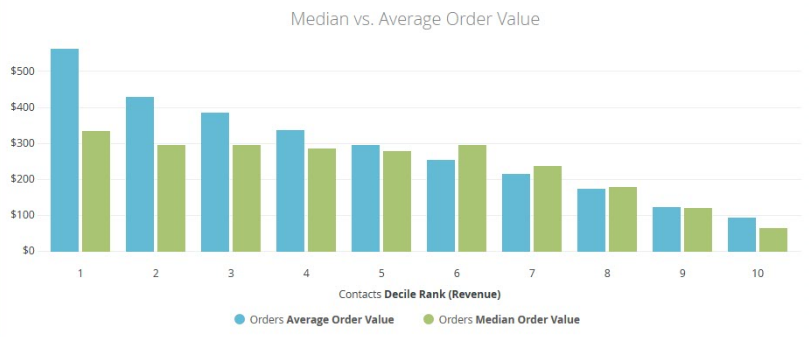
So, obviously AOV is a very helpful analytic when looking at sales but does it really show you the full picture? When these numbers vary as much as they do in the chart above, how do you know that relying on the AOV is the best option in this scenario? There is a need to have an understanding of both the median and average order values to see the full picture.
Identifying Potential Return Customers With Average Order Value
Now back to customer AOV. Your customers are different, but they can be grouped by several similarities. Simply by looking at AOV by customer decile, you can start to identify shoppers with the highest likelihood to become your next best customers before they even make their second purchase.
This could be your biggest tool when it comes to marketing to loyal and repeat customers. Knowing how people are purchasing and when they are likely going to make another purchase is a huge advantage and allows you to market to exactly where they fall in the buyer's journey.
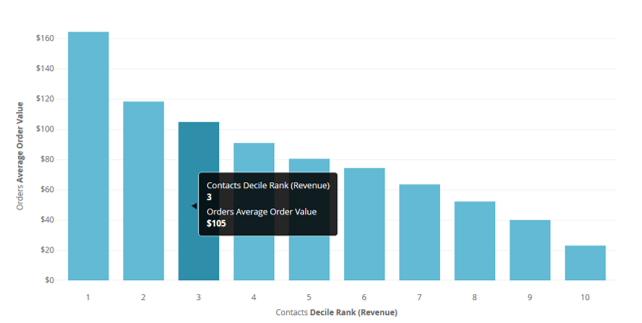
In the chart below, you can see how the top three (3) deciles produce an AOV between $105-164 which could be used to put an automated campaign in place to nurture first-time buyers to a second purchase, bolstering your best customers segment.
The information that you can gather from breaking down the AOV of your customer base on a more granular level provides even more data. It can open your eyes to new ideas for campaigns on both ends of the spectrum. For your frequent and high spending customers, you may realize it’s time to start a loyalty or rewards program to keep them coming back. And for those in the lower AOV decile, a nurturing campaign may be just what they need to increase the value of what they are purchasing.
Monitoring Average Order Value Over Time
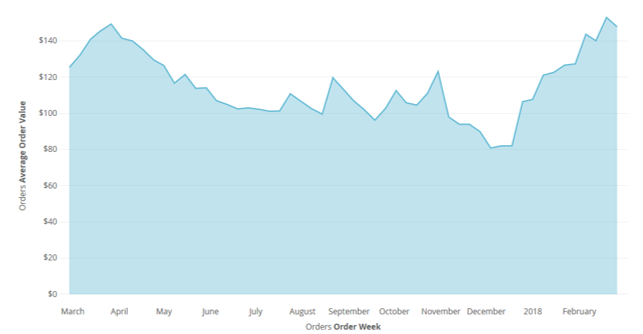
Another way to break down your AOV a step further would be to track it over time. By plotting AOV by week, you can spot trends and then break down buyers from that period to identify trends in products or categories. From there, you can take a detailed look at what trends are happening with AOV throughout the year -- providing a holistic view of how your customers are spending their money.
In the example below, we can see that the AOV for the year is $115 but it varies from $82 to $149 throughout the year. That’s an 82% jump and when you look at the people who made their first purchase during that AOV peak; the customer’s average lifetime value (LTV) based on a first purchase in March/April jumps from $163 to $296, another 82% increase. Coincidence? Not really, once you do the math.
Hopefully, this gives you a perspective on AOV that you never considered before. We need to stop thinking about our customers as one big mob of people. By using a customer analytics platform like Listrak CRM, we can help show you the secrets that lie within your customer data.


.png)
